

Overview: Google Analytics now has a free AI assistant. I asked it and Claude the same questions about a real site. GA4 won the quick one. On the harder one, it counted the same drop three times; Claude found the channel hiding the loss. Below: the test, then how to set up the Claude side in two ways, and a report that lands in your inbox every Monday.
Most owners open Google Analytics for one reason: something moved and they want to know why. GA4 now has its own AI assistant for exactly that, and it’s free. So before teaching anyone to wire Analytics into Claude, I wanted to know if it’s even worth it. I ran both on the same site, with the same questions, on 16 November 2026.
The test: same questions, same site
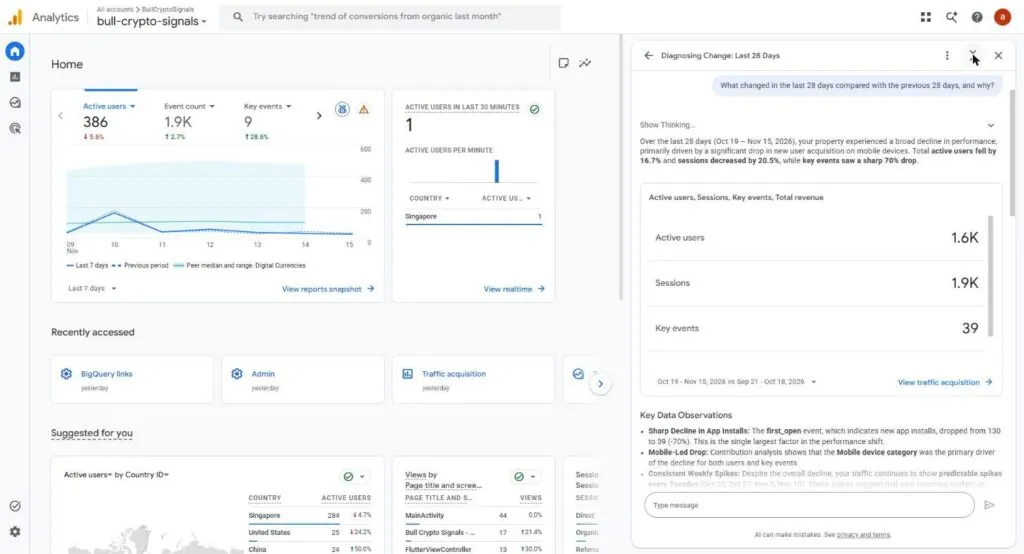
Question 1: “What changed in the last 28 days, and why?”
GA4’s assistant answered in about a minute. Sessions down 20.5%, key events down 70%, and the cause: new app installs (the first_open event) fell from 130 to 39. That’s a real answer, and it took no setup at all.
Claude, working from a CSV export of the same period, gave me the numbers but not the cause. One point to GA4. For a quick “what changed?”, use the free tool you already have.
Question 2: a harder one
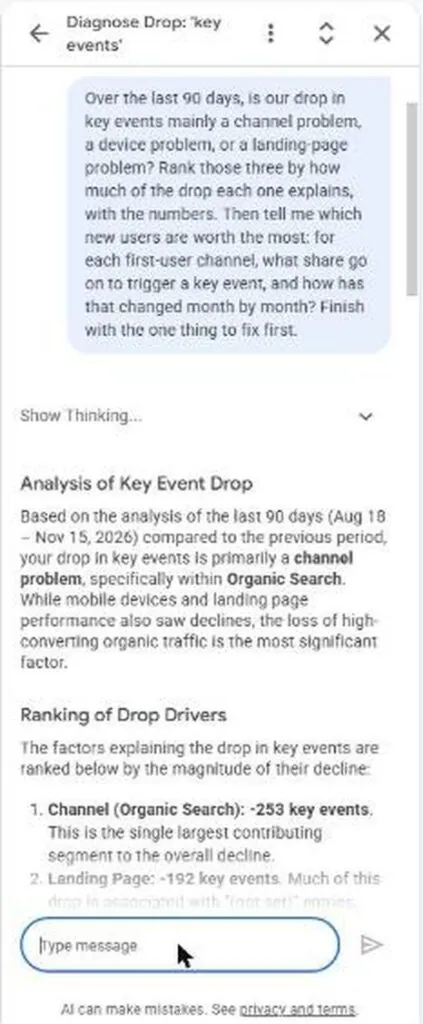
Then I asked something an owner actually needs answered before spending money: “Over the last 90 days, is our drop in key events mainly a channel problem, a device problem, or a landing-page problem? Rank those three by how much of the drop each one explains, with the numbers. Then tell me which new users are worth the most, month by month. Finish with the one thing to fix first.”
GA4 ranked three causes: Organic Search (−253 key events), landing pages (−192) and mobile (−188). The trouble is those aren’t three causes. They’re three views of the same events, so they add up to far more than the actual drop. It also said 39.46% of new organic users went on to trigger a key event, while its own table works out to about 29%. And it called key events “relatively flat” right above a table showing organic falling from 116 to 54 to 50.
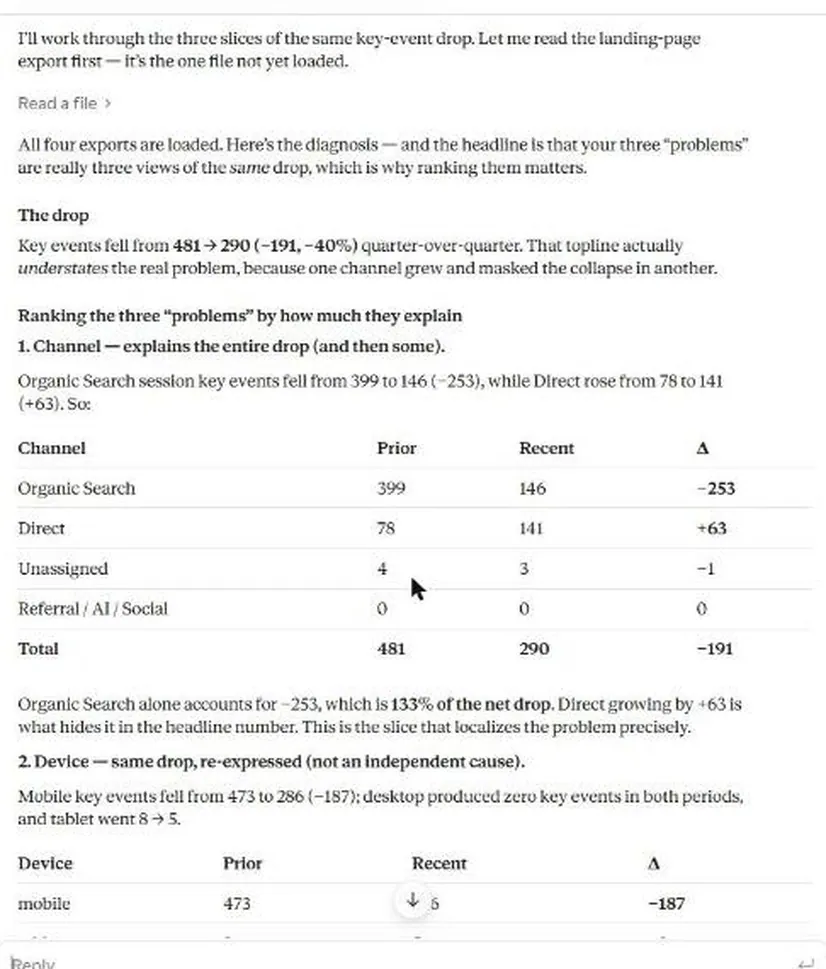
Claude, given four GA4 exports, said it plainly: the three “problems” are one drop seen three ways. Key events fell from 481 to 290 (−191, −40%). Organic Search lost 253, which is 133% of the net drop, because Direct grew by 63 and hid part of the loss in the headline number. It then split the damage into lost traffic and lost conversions, so you know which one to fix first.
The verdict
- GA4’s assistant: quick, simple questions. Free, instant, no setup.
- Claude: deeper analysis, your own files and other sources next to Analytics (GA4’s chat won’t take uploads), a dashboard that keeps itself up to date, and a scheduled report.
If you only ever ask “what changed?”, stop here and use GA4. If you want the second kind of answer, here’s the Claude side.
Two ways to set it up
| Quick way: a GA4 export | Live way: BigQuery + connector | |
|---|---|---|
| Ready | Today | Once a few days of data are in |
| History | Everything you already have | Only from the day you link |
| Updates | A snapshot: re-export to refresh | Keeps itself up to date |
| Setup | One download | Two Google steps and a connector |
| Cost | Claude Pro | Claude Pro; Google’s side free (daily export) |
What it costs (checked on claude.com/pricing, 17 November 2026; check again before you sign up): Claude Pro is $20 a month billed monthly, or $17 a month on the annual plan ($200 up front). Claude Data dashboards aren’t on the Free plan. Google’s side is $0 for the daily export on the BigQuery Sandbox, where tables expire after 60 days. The streaming (intraday) export needs billing turned on in Google Cloud.
The quick way: a GA4 export into Claude
- In Google Analytics, open Reports → Traffic acquisition.
- Turn on Compare (previous period), then Share → Download file → CSV.
- In Claude, on a paid plan: Artifacts → Data → Import a file. Attach the CSV and describe the dashboard you want: totals, the period-over-period change, sessions by channel, and anything that moved sharply.
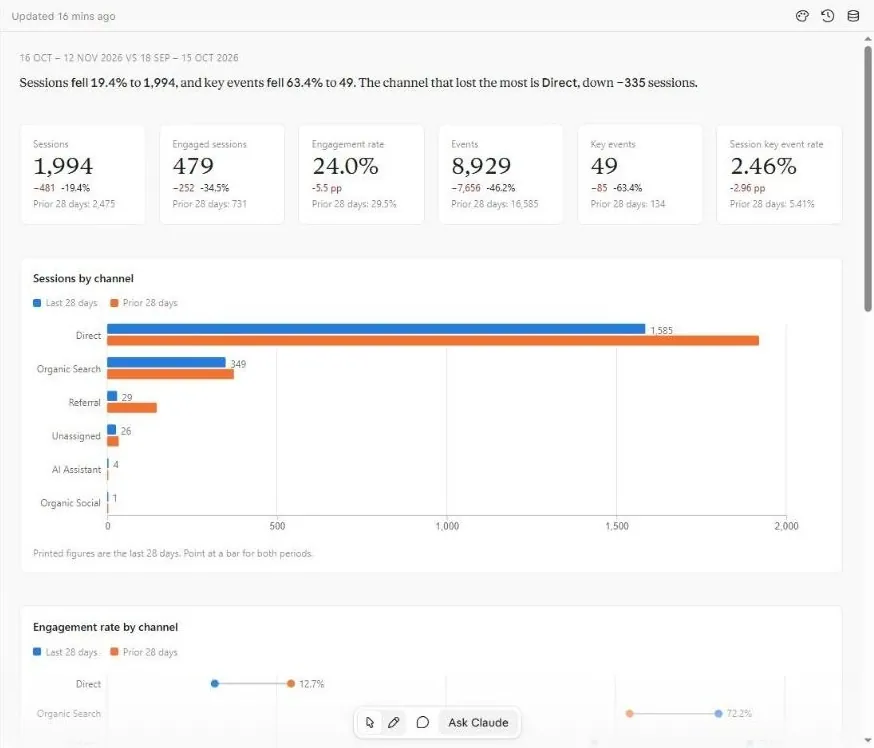
From one file, Claude found visits down 19%, key events down 63%, and referrals nearly gone. The catch is that it’s a snapshot. Next week you export again.
The live way: link GA4 to BigQuery, then connect Claude
You need a GA4 property you can edit and a Google Cloud project.
Step 1: create a Google Cloud project and open BigQuery
In the Google Cloud console, create a project and open BigQuery. If you see the Sandbox label, there’s no card on file. Tables there expire after 60 days, which is fine for a rolling dashboard.
Step 2: link Analytics to BigQuery
In Analytics: Admin → Product links → BigQuery links → Link. Pick your project and a location, then choose Daily or Streaming. Daily is free on the Sandbox; Streaming needs billing.
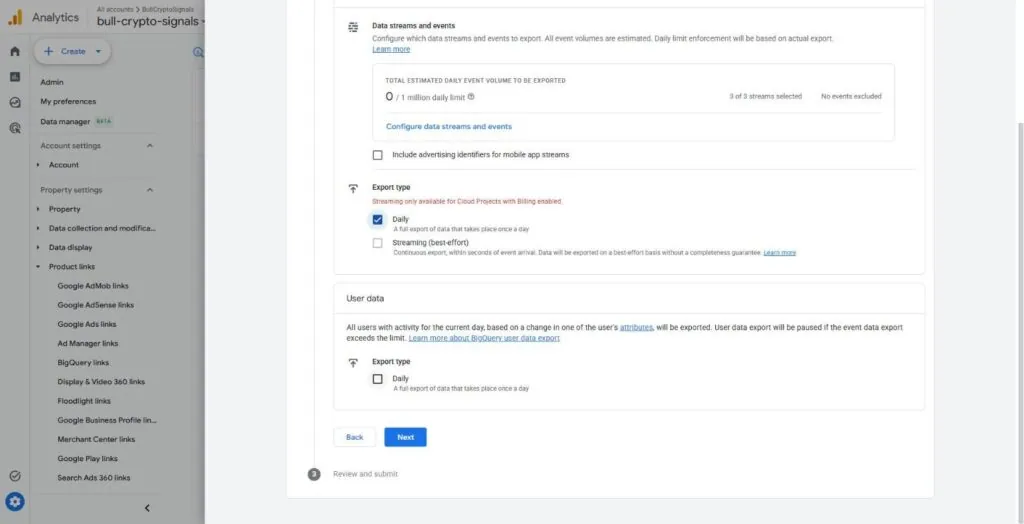
Two traps catch most people:
- You need the Owner role on the Cloud project.
- A property gets one BigQuery link. If someone linked it before, you’ll find it already taken.
Step 3: connect Claude to BigQuery
In Claude: Customize → Connectors → Google Cloud BigQuery → Connect. Read the consent screen before you allow it: it lets Claude view and manage your BigQuery data.
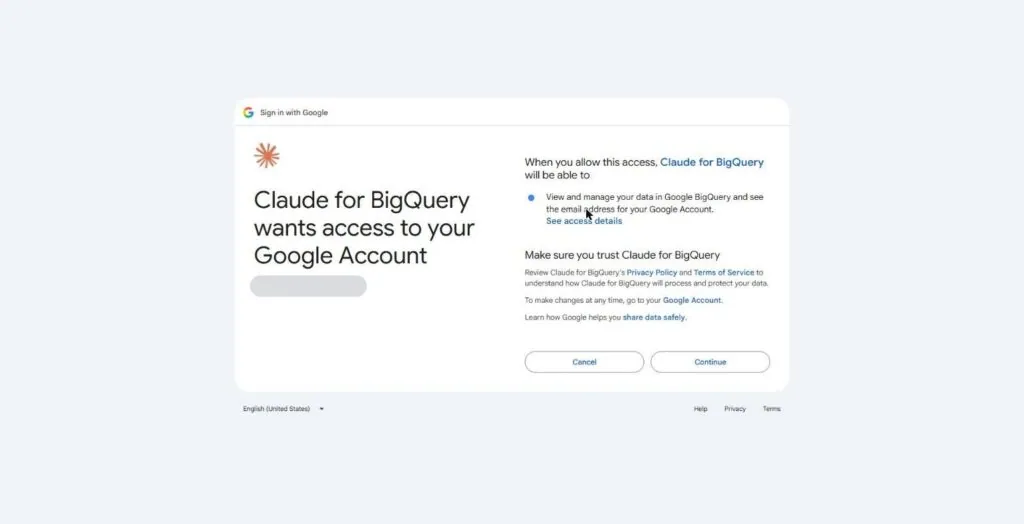
Step 4: build the dashboard
Artifacts → Data → Use a connector. Name your project and dataset, and list the charts you want. Claude takes a few minutes, asks you to allow the connector, and then the numbers load. Every chart shows the query behind it, and the dashboard keeps itself up to date: open it and you see the latest numbers.
Step 5: ask what changed
Once a few days are in, ask it. On Google’s public GA4 sample store (I used it because a new link starts empty), sessions fell 11% and one page accounted for about a quarter of that.
A report every Monday, without opening anything
In Claude, go to Scheduled → New task. Paste your instructions (what to compare, what to flag, where to write it), pick Weekly, Monday at 9:00, and turn on email. Every Monday, Claude reads your data, writes the report into a Google Doc and emails you when it’s done.
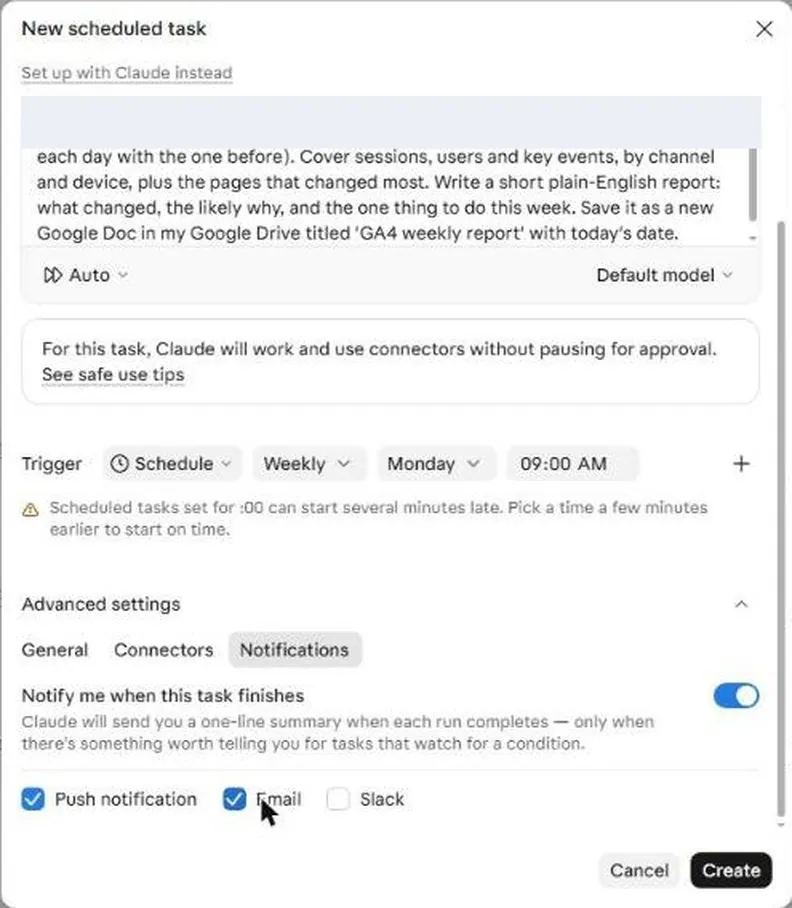
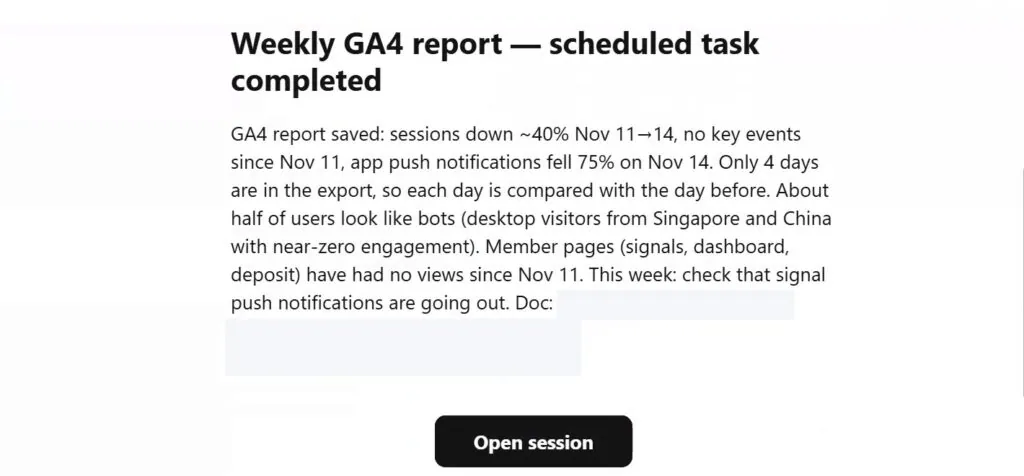
My first run flagged that member pages had no views since 11 November and that about half the users looked like bots, with the one thing to check that week.
Prefer a Looker Studio email instead? My Search Console video shows that at 5:56.
What it won’t do
- The live way has nothing from before the day you link. Use the quick way for history.
- Claude reads and reports. You still decide what to fix.
- The Sandbox deletes tables after 60 days. Turn on billing if you need longer history in BigQuery.
If you’d rather not do the setup yourself, I’ll set up BigQuery, the dashboard and the Monday report for you: email info@digitalonian.com.
Get the next build in your inbox
The Digitalonian Brief sends working AI builds like this one, step by step. Free.